|
Steele Creek Neighborhoods Maintain Quality, Study Shows
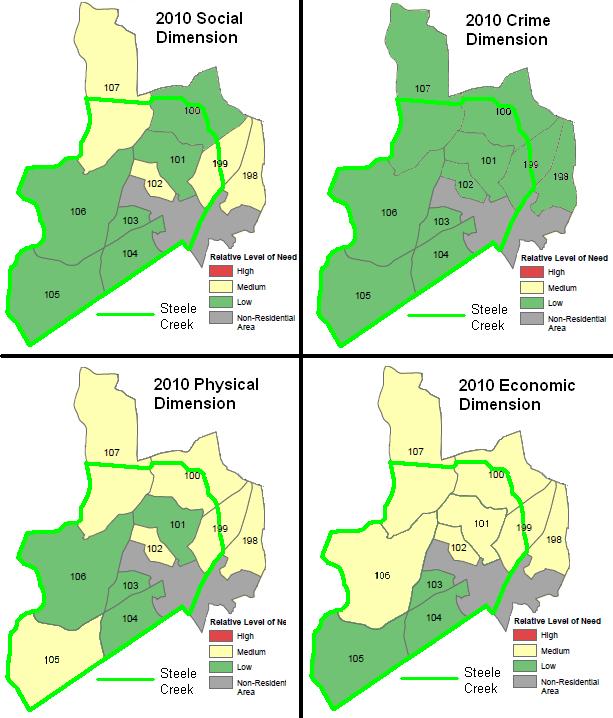
The study evaluates social, crime, physical, and economic conditions in Charlotte's neighborhoods and is used by local government to evaluate neighborhood conditions and make changes to improve neighborhood vitality.
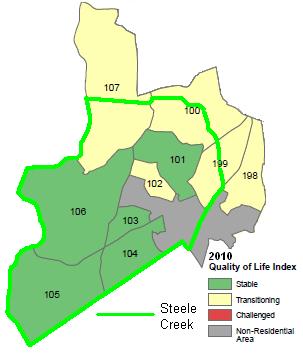
As the map to the right shows, all NSAs in Steele Creek are classified as either stable or transitioning. No NSAs have changed in classification since the 2006 study, but four (100. 103, 105, and 199) have trended up. See more results on the city's Charlotte Neighborhood Quality of Life web page. The study excludes non-residential areas, such as the Westinghouse Boulevard corridor. One boundary change was made since the last study in 2008. The Ayrsley area was transferred from the Non-Residential Area to NSA 101 for this year's study. As the maps below show, three NSAs have a medium level of need in the Social Dimension. Factors affecting these ratings most likely are: NSA 102 - Percent of births to adolescents and Youth Opportunity Index; NSA 107 - Percent of persons over the age of 64; and NSA 199 - Dropout rate and percent of births to adolescents. The Youth Opportunity Index attempts to measure potential opportunities for youth to get involved in extra-curricular activities within the NSA. The index for NSA 102 is arbitrarily low because it is almost 100% residential and contains no churches, schools, recreation centers, or libraries. All NSAs show a low level of need in the Crime Dimension. Variables for almost all NSAs were well below the rates for the city as a whole. This may come as a surprise to people who have the false perception that Steele Creek has high crime. The study shows that much of Steele Creek has medium need in the Physical Dimension. One factor used in this dimension is projected infrastructure improvement cost, which estimates the cost of providing sidewalks, curbs, and minor drainage improvements where they are lacking. Many parts of Steele Creek rate low in this dimension because may neighborhoods were built before current subdivision standards were in place or they contain area that is still largely rural. Other factors include percent of persons with access to public transportation, percent of persons with access to basic retail, and pedestrian friendliness, all of which would tend to be lacking in rural areas of Steele Creek. Much of Steele Creek falls in the medium need category in the economic dimension. This is primarily due to rates of percent change in income and percent change in housing value that are below the city rate. Dr. Owen Furuseth of UNCC, who directed the study, said in a recent community workshop that many Charlotte neighborhoods took a big hit from 2008 to 2010 due to the national economic situation, which has caused housing values to go down and unemployment to go up. The maps below
show the categories in the four dimensions for Steele Creek NSAs.
For more details, click on the 2010 Quality of Life link on the
city's
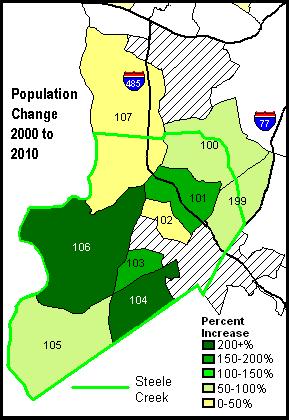
Charlotte Neighborhood Quality of Life web page. What the study report fails to note is the one big change that has been occurring in Steele Creek: the population is booming. The 2000 study showed a total population of about 20,900 in Steele Creek. The population reported in the 2010 study is about 48,061, an increase of about 130% in ten years. Even though growth has recently ground to a crawl, the latest study showed 2008-2010 with the highest increase (6504) of any two year period. The table below shows population reported for the six NSAs entirely within Steele Creek and uses one half of the reported population for the three NSAs partly within Steele Creek.
The study assigns names to each NSA. Most of the names for NSAs in Steele Creek do not accurately represent the complete NSA areas.
Five of these (Eagle Lake, Olde Whitehall, Griers Fork, Yorkshire, and Pleasant Hill Road) are named after smaller neighborhoods within them. Only Yorkshire takes up more than a small portion of its NSA. It appears that these names were selected because someone within each of the neighborhoods had signed up for the Planning Department's Neighborhood Contact List. Most should have different, more representative names. NSA 103 is named Brown Road, but it contains no road named Brown Road, and the origin of that name is a mystery. NSA 106 is named Steele Creek, but certainly is a small part of the larger Steele Creek community. Dr. Furuseth said that they will be evaluating the boundaries and names of NSAs before the next study in 2012. There will be community meetings about possible changes. To comment on this story, please visit the Steele Creek Residents Association Message Board. |
||||||||||||||||||||||||||||||||||||||||||||||||||||||||||||||||||||||||||||||||||||||||||||||||||||||||||||||||||||||||||||||||||||||||||||||||||||||||||||||||||||||||


 The Neighborhood Quality of Life Study divides the
city and its
future annexation areas into 173 Neighborhood Statistical Areas (NSAs).
The study examines 20 neighborhood variables in each NSA, mostly collected from
local databases maintained by the City of Charlotte, Mecklenburg
County, and Charlotte-Mecklenburg Schools. The research converts the
individual statistical values into three NSA neighborhood-ranking
categories of stable, transitioning, or challenged.
The Neighborhood Quality of Life Study divides the
city and its
future annexation areas into 173 Neighborhood Statistical Areas (NSAs).
The study examines 20 neighborhood variables in each NSA, mostly collected from
local databases maintained by the City of Charlotte, Mecklenburg
County, and Charlotte-Mecklenburg Schools. The research converts the
individual statistical values into three NSA neighborhood-ranking
categories of stable, transitioning, or challenged.